Perform copula-aided reconstruction, analysis and plot of a multi-omics network
carmon.RdSingle wrapper function encompassing all the functional units of the carmon package: copula-based transition of non-normal data to the normal realm, network reconstruction and selection, consensus centrality analysis of the network to identify key omics features, and enriched plot of the network and of the analysis results.
Usage
carmon(
  layers,
  ...,
  p = NULL,
  omics = NULL,
  marginals = NULL,
  noninv_method = NULL,
  copula = NULL,
  net_method = "coglasso",
  sel_method = NULL,
  cor_cutoff = NULL,
  cor_quant = NULL,
  minimal_output = FALSE,
  analyse = TRUE,
  c_measures = "dbce",
  max_candidates_c_measures = NULL,
  quantile_c_measures = NULL,
  scaled_c_measures = TRUE,
  plot = TRUE,
  plot_node_labels = TRUE,
  hide_isolated = TRUE,
  plot_hot_nodes = TRUE,
  verbose = 1
)
Arguments
- layers
The omics layers to analyze. They can be provided in three possible formats, and they should always contain source-matched, non-normalized data, to use carmon to its full potential.
A named R list of omics data sets (recommended). If possible the names of the list should correspond to the respective omics type. If not possible, for example because of two layers from the same technology, please provide the omics types with the parameter
omics. To see a list of available omics types use the functionwhich_omics().
Each data set should be source-matched (same amount of matched samples or individuals across each data set). Placing of the samples (or individuals) should also be consistent: either along the rows for all the data sets, or along the columns for all the data sets, nothing in between. All the samples (or individuals) should also have consistent naming across the data sets.An object of
S4classMultiAssayExperiment(morehere). In that case, we recommend using theomicsparameter to specify which are the omics layers contained in the object, in the same order as presented byMultiAssayExperiment::experiments(layer). This allows to use carmon to its full potential. To see a list of terms and omics technologies for which carmon is specifically tailored, use the functionwhich_omics(). Please remember thatcarmon()expects data to be non-normalized, meaning that for RNA-seq data, for example, it will expect data to be in the form of counts.A single unified data set, but then it is necessary to specify the argument
p. We also recommend using theomicsparameter to specify which are the omics layers contained in the data set.
- p
Necessary only in case
layersis a single data set. A vector with with the number of variables for each omic layer of the data set (e.g. the number of transcripts, metabolites etc.), in the same order the layers have in the data set. If the sum of the elements inpis less than the real number of features in the data set,carmon()assumes that there is an omics layer more, with as many features as the real number of features minussum(p).- omics
Highly recommended. A character vector of as many elements as the number of omics layers, naming which omics types each layer contains, in the same order as provided in the input
layers(e.g.omics = c('RNA-seq', 'proteomics', 'metabolomics')). To see a list of terms and omics technologies for which carmon is specifically tailored, use the functionwhich_omics().- marginals
Optional, to be specified when the user prefers to use different marginal distributions than the default distribution carmon tailored for each omics layers. A vector of as many elements as the number of layers, specifying which marginal distribution should be used for each omics layer, in the same order as provided in the input
layers. To see a list of available marginal distributions, use the functionwhich_marginals(). For a mixed custom setting, place a0in the vector in the position corresponding to the omics layers for which the default distribution is desired. Otherwise, specify the desired marginal distribution (e.g.marginals = c(0, 'lognormal', 0)means 'default, lognormal, default').- noninv_method
A placeholder for future functionalities of carmon, do not use.
- copula
A placeholder for future functionalities of carmon, do not use.
- net_method
The network reconstruction method to use. The four methods currently available are:
'coglasso'for collaborative graphical lasso,'glasso'for graphical lasso,'mb'for the Meinshausen-Buhlmann neighborhood selection, and'correlation'for a thresholded Pearson's correlation network. The default method is'coglasso'. See References for more information on the network reconstruction methods.- sel_method
The network selection method. Each reconstruction procedure has its own set of model selection procedures available. See References for more information on the network selection methods. Here is the list of them:
for
net_method = 'coglasso':'xstars'for eXtended StARS,'xestars'for eXtended Efficient StARS, and'ebic'for Extended Bayesian Information Criterion. Default is'xestars'.for
net_method = 'glasso':'stars'for StARS,'ric'for Rotational Information Criterion, and'ebic'for Extended Bayesian Information Criterion. Default is'stars'.for
net_method = 'mb'or'correlation':'stars'for StARS, and'ric'for Rotational Information Criterion. Default is'stars'.
- ...
The additional optional arguments to be given for the network reconstruction and selection procedure. The available arguments depend on the chosen network reconstruction and network selection methods. If using
'coglasso'(default option), seecoglasso::bs()for both reconstruction and selection arguments. If reconstructing with'glasso','mb', or'correlation'without settingcor_cutofforcor_quantsee, respectively,huge::huge.glasso(),huge::huge.mb(), orhuge::huge.ct(). For additional options for network selection from these last three reconstruction methods, seehuge::huge.select().- cor_cutoff
Optional for
net_method = 'correlation'. The cutoff value for the absolute Pearson's correlation network. Any edge with an absolute correlation below the cutoff is excluded from the final network. Not used by default, as the cutoff is generated by internal calculations.- cor_quant
Optional for
net_method = 'correlation', to set as an alternative tocor_cutoff. Determine the cutoff of correlation based on the top percentile indicated by the user. For example,cor_quant = 0.2would set as a correlation cutoff the 20th percentile of the absolute Pearson's correlation values, ordered from highest to lowest. Not used by default, as the cutoff is generated by internal calculations.- minimal_output
Logical. Set to
TRUEto get only a minimal output from the network reconstruction and selection module ofcarmon(), which mainly differs on the basis of on the network reconstruction method set withnet_method.Defaults toFALSE.- analyse
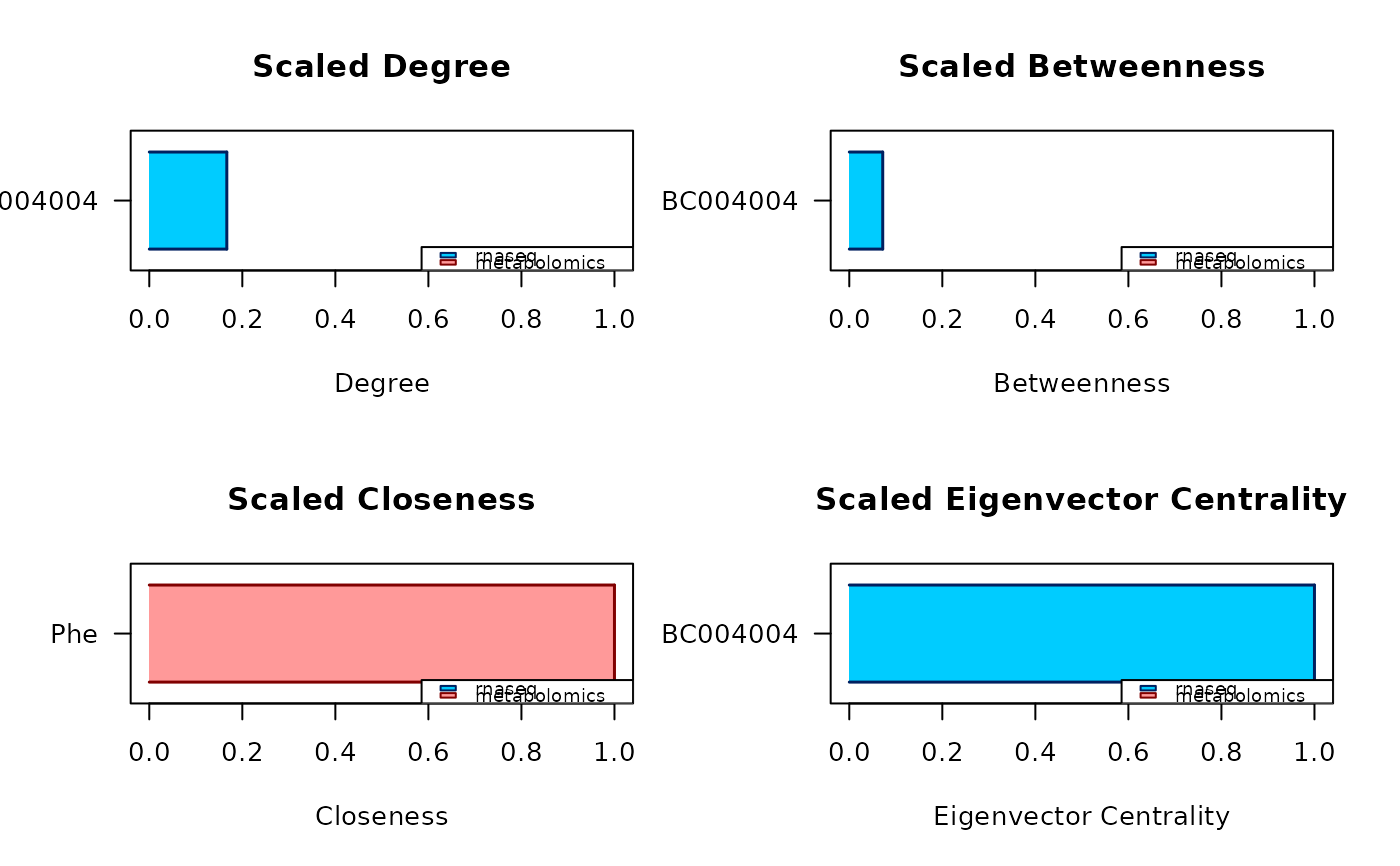
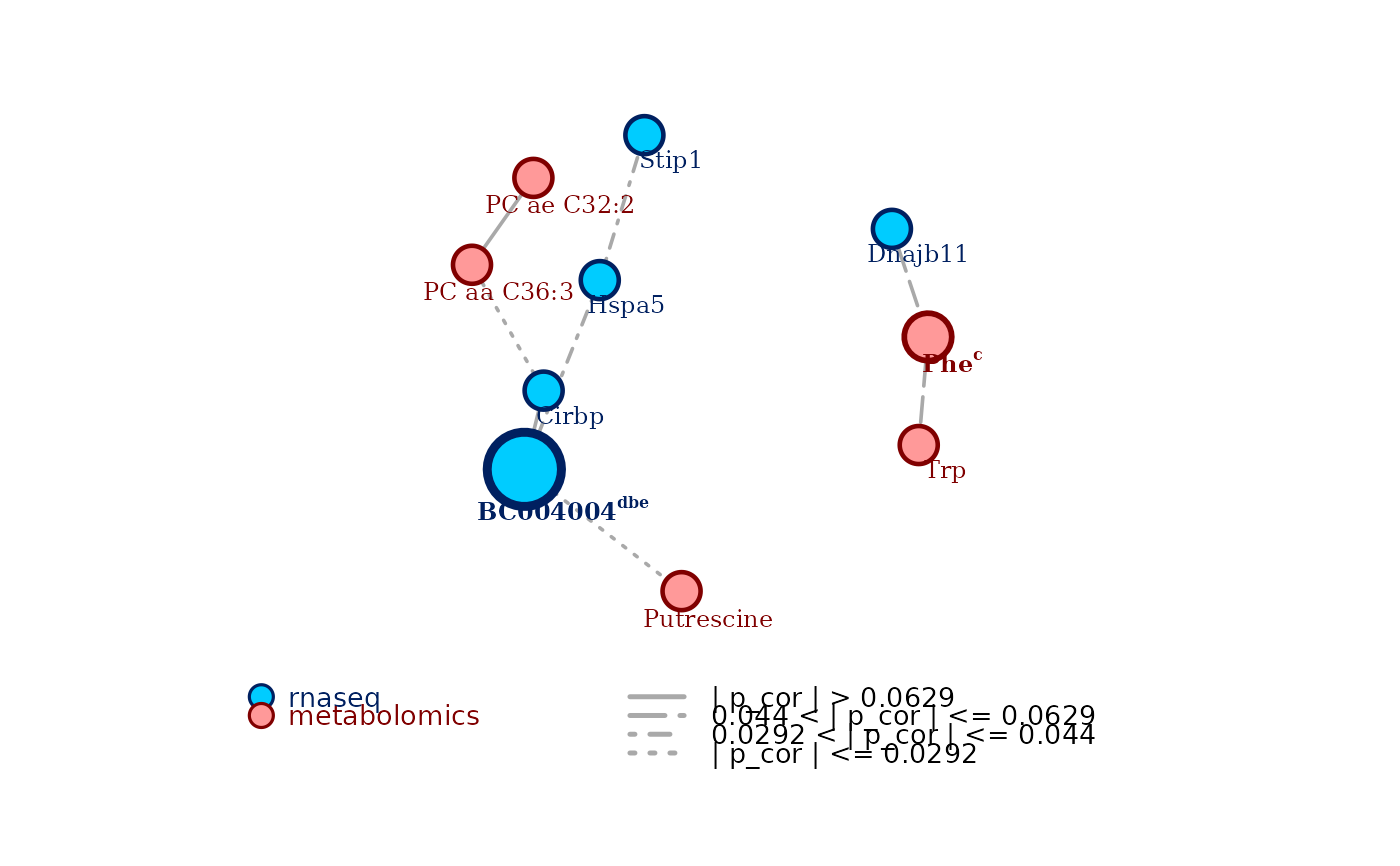
Logical. Whether to perform the consensus centrality analysis to identify key omics features. The highlighted features are important based on a consensus of multiple centrality measures. Defaults to
TRUE.- c_measures
A string of characters, each one representing one of four possible centrality measures implemented in the consensus centrality analysis:
'd'stands for degree centrality,'b'for betweenness centrality,'c'for closeness centrality, and'e'for eigenvector centrality. Default is'dbce': all the four measures.- max_candidates_c_measures
What is the highest amount of nodes that can be highlighted by each measure of centrality, before finding the consensus? Default is 20. When given together with the
quantile_c_measuresargument, it overrides thequantile_c_measuresargument whenmax_candidates_c_measuresis smaller than the chosen quantile, it is overrode byquantile_c_measuresin the opposite case.- quantile_c_measures
What is the top percentile of nodes that can be highlighted by each measure of centrality, before finding the consensus? Default is the top 5%. When given together with the
max_candidates_c_measures, it overrides themax_candidates_c_measuresargument when the amount of nodes in the chosen top percentile is smaller than the chosen maximum amount of candidate nodes, it is overrode bymax_candidates_c_measuresin the opposite case.- scaled_c_measures
Logical. Whether to compute centrality measures as 0-1 scaled values. Defaults to
TRUE.- plot
Logical. Whether to plot the multi-omics network (enriched by the results of the centrality analysis when that is performed), and the results of the centrality analysis (when performed). Defaults to
TRUE.- plot_node_labels
Show node names in the plot of the network. Defaults to
TRUE.- hide_isolated
Hide from the plot nodes that are not connected to any other node. Defaults to
TRUE.- plot_hot_nodes
Highlight in the plot nodes that are selected as consensus-central nodes by the node centrality analysis, by drawing them bigger and adding the criteria for which they result to be central. The larger the consensus, the bigger the nodes are plotted. Defaults to
TRUE.- verbose
The level of verbosity of the
carmon()process.0suppresses the information output, while1and2give progressively increasing amounts of information about the inner computations happening inside the package's modules. Defaults to1
Value
carmon() returns an object of S3 class carmon. The elements of
this object depend on the chosen network reconstruction ('coglasso', by
default) and selection ('xestars', by default) strategies, and on whether
or not the consensus centrality analysis is carried out (yes, by default).
Every possible running mode of carmon() produces a carmon object
with the following elements:
layersis an R list, each element being a data set of the corresponding omics layer, already copulized and transferred to the normal realm.omicsis a vector containing the omics type assigned to each omics layer.marginalsis a vector containing the marginal distributions used to transfer each omics layer to the normal realm.sel_adjis the adjacency matrix of the final selected carmon network.net_methodis the chosen network reconstruction method.sel_methodis the chosen model selection method.networkis theigraphnetwork object of the final selected carmon network.callis the matched call.
Depending on the different network reconstruction and selection strategies
chosen, some of the other elements may change. When choosing 'coglasso' or
'glasso' as network reconstruction method, an additional returned element
is:
sel_icovis the inverse covariance matrix of the final selected network.
Otherwise, if choosing 'correlation', carmon() also returns:
coris the Pearson's correlation matrix of the final selected network.
When minimal_output is set to TRUE, these are also the only elements
returned in the object of S3 class carmon given by carmon(). For
the non minimal output elements resulting from network reconstruction and
selection, please look at coglasso::bs() for net_method = 'coglasso'.
When using 'glasso', 'mb', and when using 'correlation' without setting
any value for cor_cutoff or cor_quant, look at huge::huge() and at
huge::huge.select().
Moreover, when analyse = TRUE (default behaviour), the carmon object
contains two additional elements resulting from the consensus centrality
analysis:
reportan R data frame. The rows correspond to the nodes identified to be central by the analysis, and they are ordered based on how large is the consensus among the different measures. The data frame has 6 columns:
candidate, the name of the central node;
degree, the degree centrality of the node;
betweenness, the betweenness centrality of the node;
closeness, the closeness centrality of the node;
eigenvector, the eigenvector centrality of the node; and
central for, the a string reporting the first letter of all the measures according to which the node is central for.measures_listan R named list of as many elements as the number of chosen centrality measures, the name of each element being the associated centrality measure. Each element is a named numerical vector, containing the measures of the top central nodes identified in the analysis. The name of each element of the vectors is the name of the node associated to the reported measure.
References
For collaborative graphical lasso and eXtended StARS, see Albanese et al. (2024)
For graphical lasso, see Friedman et al. (2007)
For neighborhood selection, see Meinshausen and Buhlmann (2006)
For the StARS selection procedure, see Liu et al. (2010)
Examples
# Suggested usage: provide input data as a named R list, each element being
# the data set of an omics layer, then let carmon do the rest. See the
# vignettes for a more custom usage!
data(multi_omics_small)
c_obj <- carmon(multi_omics_small, verbose = FALSE)