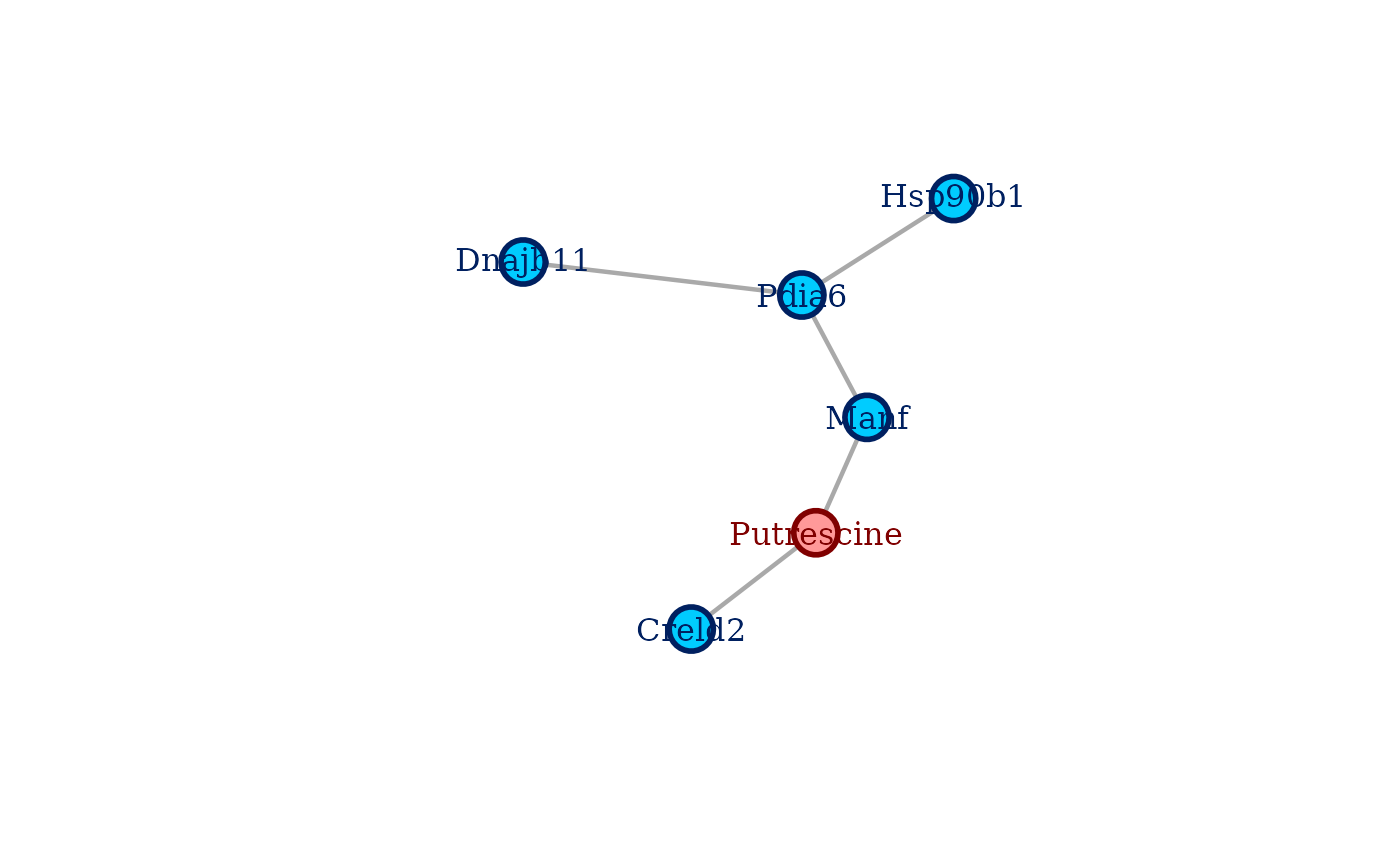
plot.select_coglasso() creates an annotated plot of a coglasso selected
network from an object of S3 class select_coglasso. Variables from
different data sets will have different color coding. To plot the network,
it's enough to use plot() call on the select_coglasso object.
plot.coglasso() has the same functioning as select_coglasso.plot(), but
from an object of S3 class coglasso. In this case, it is compulsory to
specify index_c, index_lw, and index_lb.
Arguments
- x
The object of
S3classselect_coglasso.- index_c
The index of the \(c\) value different from the one selected by model selection. To set only if the desired network is not the selected one.
- index_lw
The index of the \(\lambda_w\) value of the chosen non-optimal network. To set only if the desired network is not the selected one.
- index_lb
The index of the \(\lambda_b\) value of the chosen non-optimal network. To set only if the desired network is not the selected one.
- node_labels
Show node names in the network. Defaults to TRUE.
- hide_isolated
Hide nodes that are not connected to any other node. Defaults to TRUE.
- ...
System required, not used here.
Details
If the input is a coglasso object, it is necessary to specify all the
indexes to extract the chosen network.
If the input is a select_coglasso object, it extracts by default the
selected network. If the selection method was "ebic", and you want to extract
a different network than the selected one, specify all indexes.
Otherwise, if the objective is to extract the optimal network for a specific
\(c\) value different than the selected one, set index_c to your chosen
one. Also here it is possible to extract a specific non-optimal network by
setting all the indexes to the chosen ones.
See also
get_network() to understand what it means to select a specific
network with index_c, index_lw, and index_lb.