plot.carmon() plots an annotated network from an object of S3 class
carmon. Nodes from different omics layers will have different color coding.
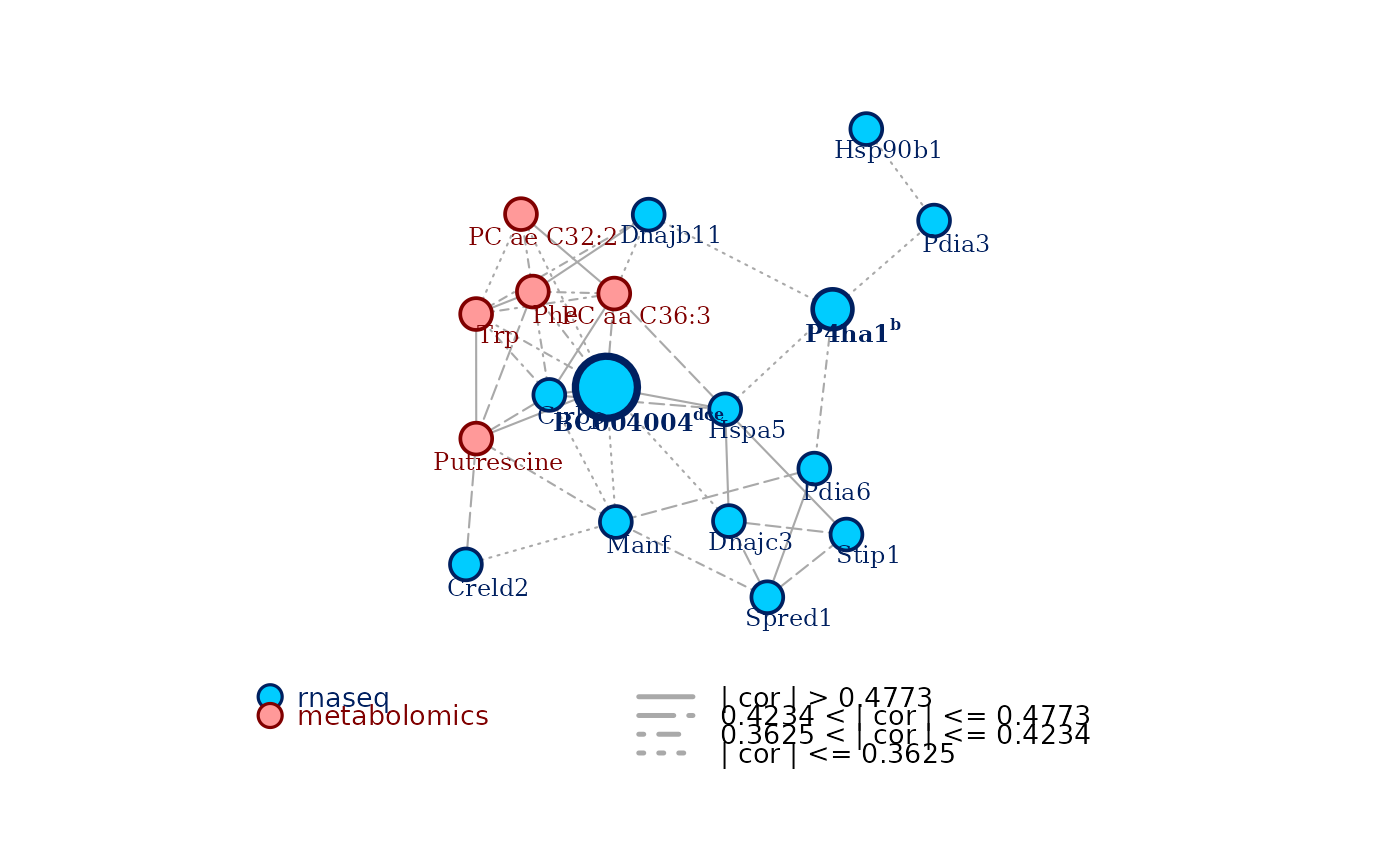
To plot the network, it's enough to use plot() call on the carmon object.
Usage
# S3 method for class 'carmon'
plot(x, node_labels = TRUE, hide_isolated = TRUE, hot_nodes = TRUE, ...)
Arguments
- x
The object of
S3classcarmon.- node_labels
Show node names in the network. Defaults to TRUE.
- hide_isolated
Hide nodes that are not connected to any other node. Defaults to TRUE.
- hot_nodes
Highlight nodes that are selected as key nodes by the node centrality analysis, by drawing them bigger and adding the criteria for which they result to be central. Defaults to TRUE.
- ...
System required, not used here.