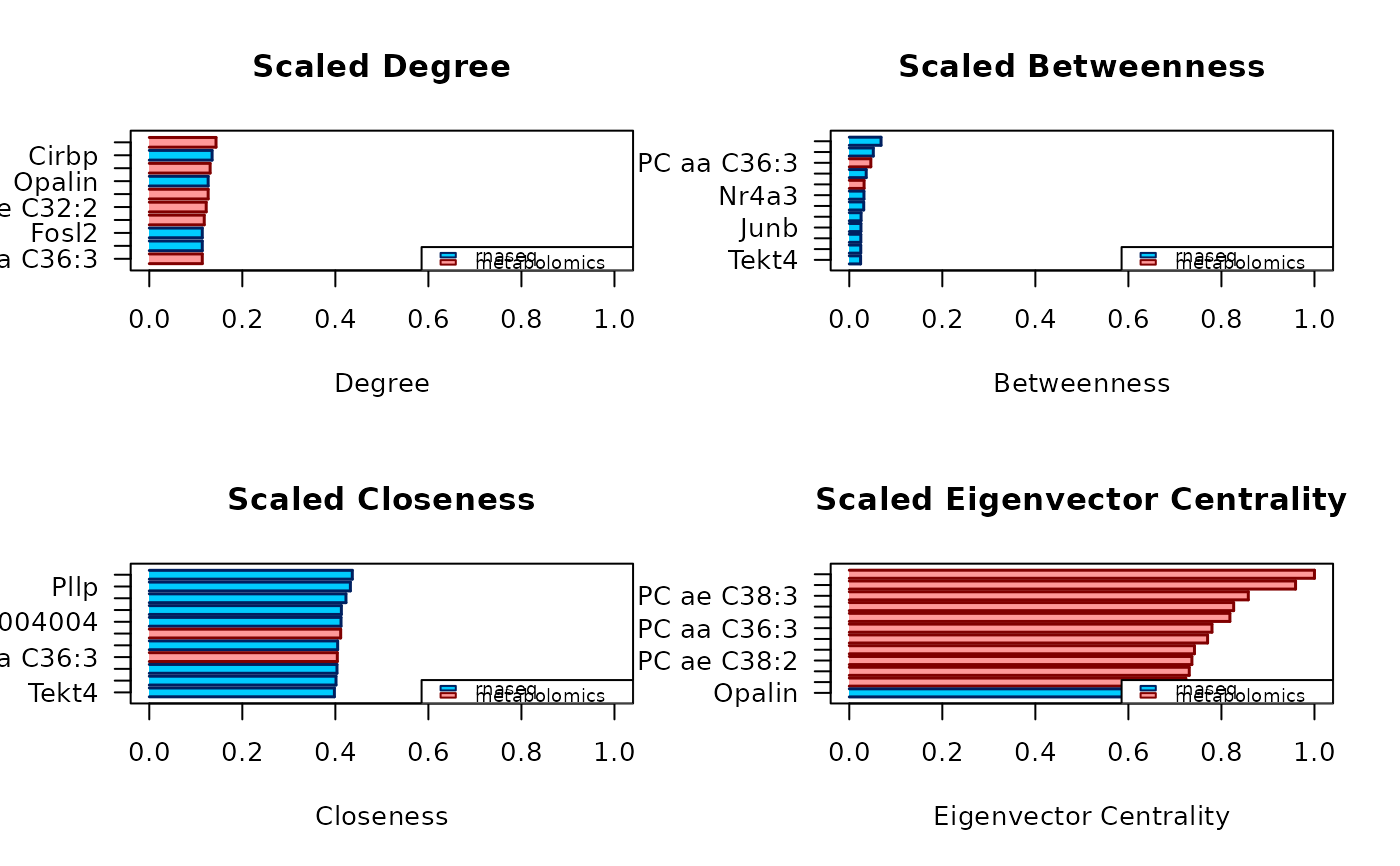
Plot the results of the node centrality analysis
Usage
plot_report(carmon_obj, scaled = TRUE)
Arguments
- carmon_obj
The object of S3 class carmon.
- scaled
Whether the centrality measures reported by the centrality
analysis are 0-1 scaled or not. Defaults to TRUE.
Value
Returns NULL, invisibly.
Examples
# Let's build and analyse a carmon network:
data(multi_omics)
c_obj <- carmon(multi_omics,
    net_method = "correlation",
    cor_quant = 0.05, analysis = TRUE, plot = FALSE,
    # analysis is already TRUE by default
    verbose = FALSE
)
# To plot the results of the centrality analysis:
plot_report(c_obj)